
Build 8 graphs using matplotlib.
I want two separate publicly traded companies e.g. AAPL & MSFT)
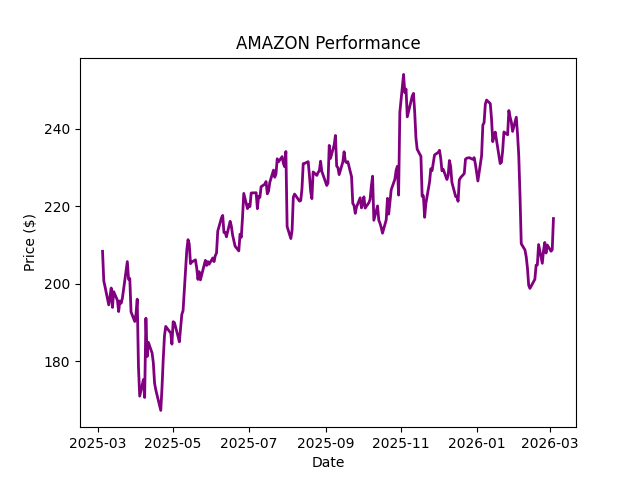
(Please don't use AMZN)
Volume and price graphs for a 1 year period
Volume and price graphs for a 90 period
Send the code in email and links to the graphs on your public cloud storage bucket.
Link to my storage bucket example.
Thanks
Adjunct Professor John Iacovacci
University of Connecticut, Stamford
John.Iacovacci@uconn.edu

No comments:
Post a Comment